See also: Item Analysis, View Student Responses
Please note: Reports showing response distribution data are designed for ADAM-delivered tests. For tests not delivered in ADAM (i.e., tests delivered through TestNav), these reports will not be useful.
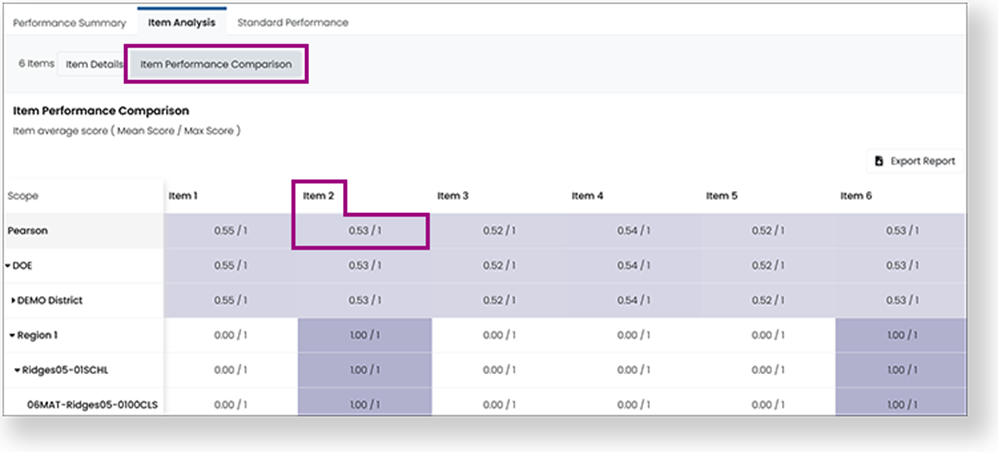
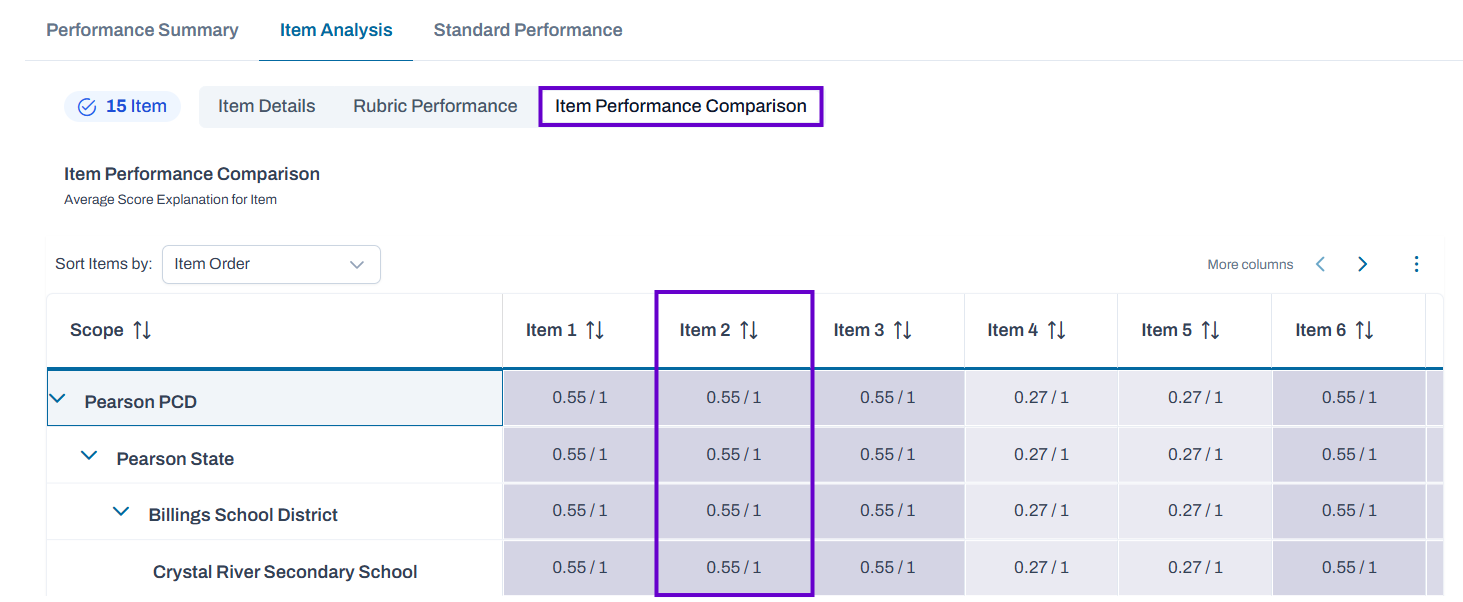
For assessments that report at the item level, permissioned users can view response and score distributions by clicking into the item column.
Classic User Interface:
Updated User Interface:
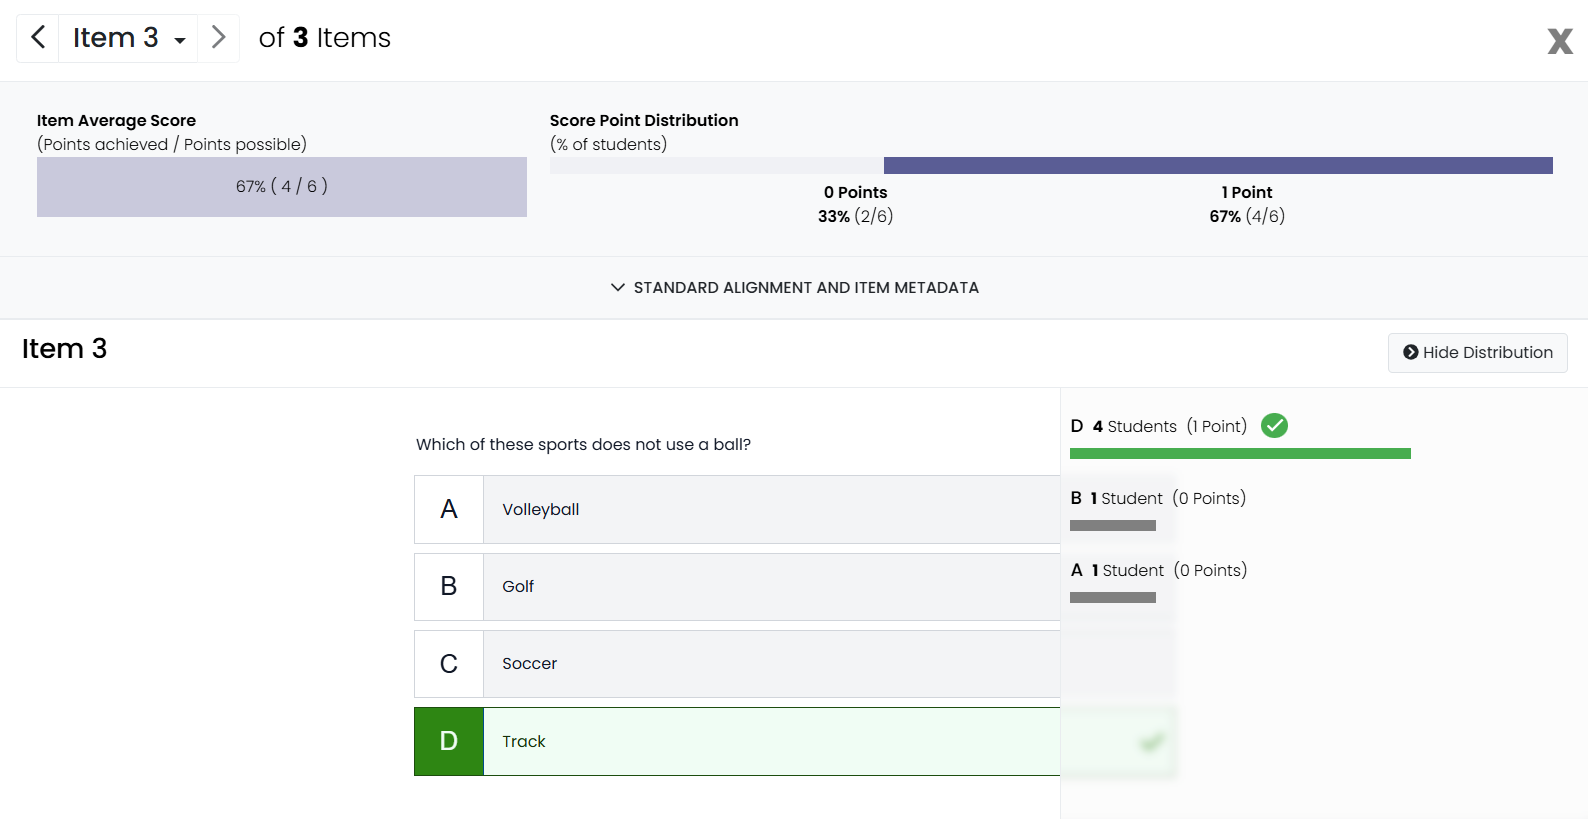
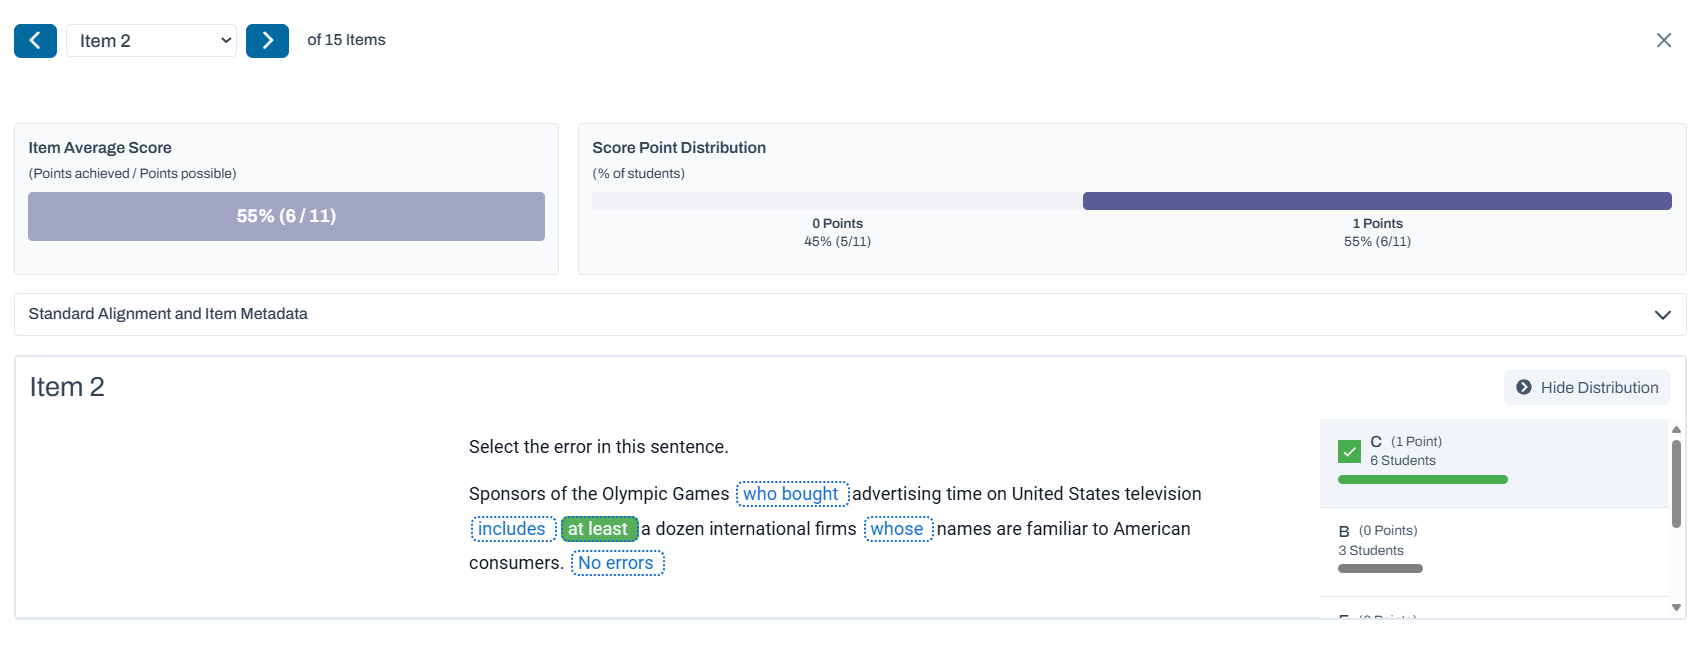
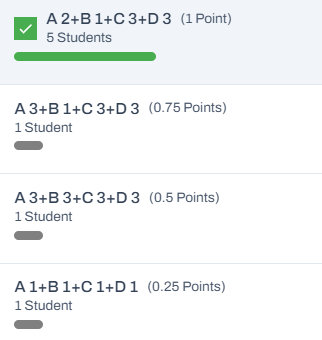
At the top of the popup, you can select the arrows or item menu to view other items in the report. Each item displays a Score Point Distribution, the number of students who achieved each point level. Most item types also have a Response Distribution; the number indicates how many students selected each response. A green checkmark indicates the correct answer. Given the large number of possible responses, some types do not display response distribution, but will still show the score point distribution.
Classic User Interface:
Updated User Interface:
Items with One Correct Answer
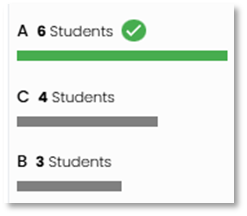
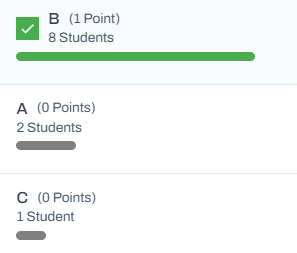
For item types that have only one correct answer, the distribution will indicate how many students selected each response. The correct answer is indicated in green and has a checkmark.
Classic User Interface:
Updated User Interface:
Items with Multiple Correct Answers
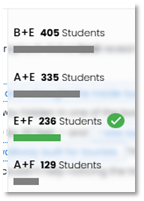
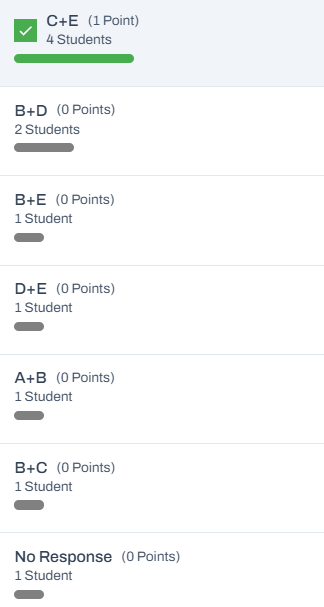
For items that allow the student to select one or more of multiple correct answers, a plus sign is used to separate the selection(s) made.
Classic User Interface:
Updated User Interface:
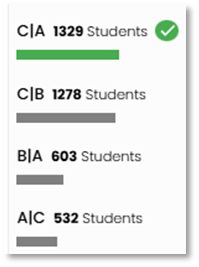
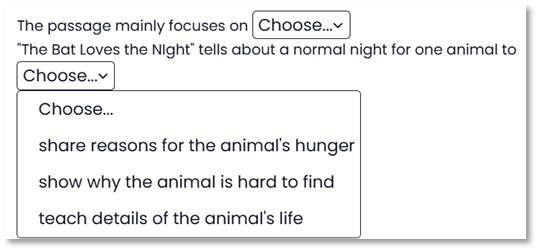
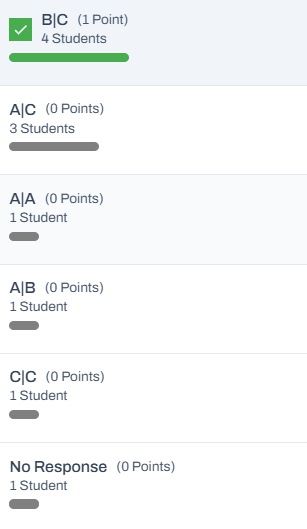
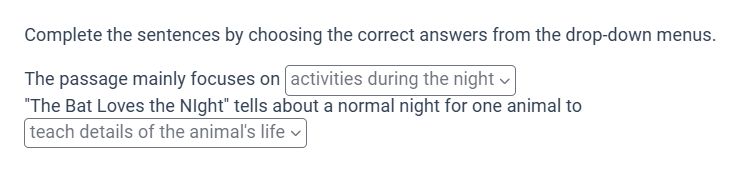
Items with Multiple Interactions
For items that have multiple interactions, a vertical bar separates each one. Letters correspond to the order of choices within each interaction.
Classic User Interface:
Updated User Interface:
Tabular Match Items
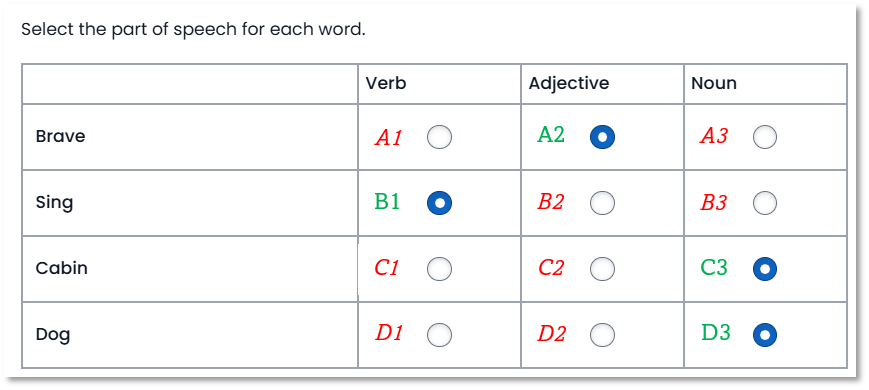
In this annotated tabular match item for illustration purposes, letters represent rows and numbers indicated columns.
Classic User Interface:
Updated User Interface:
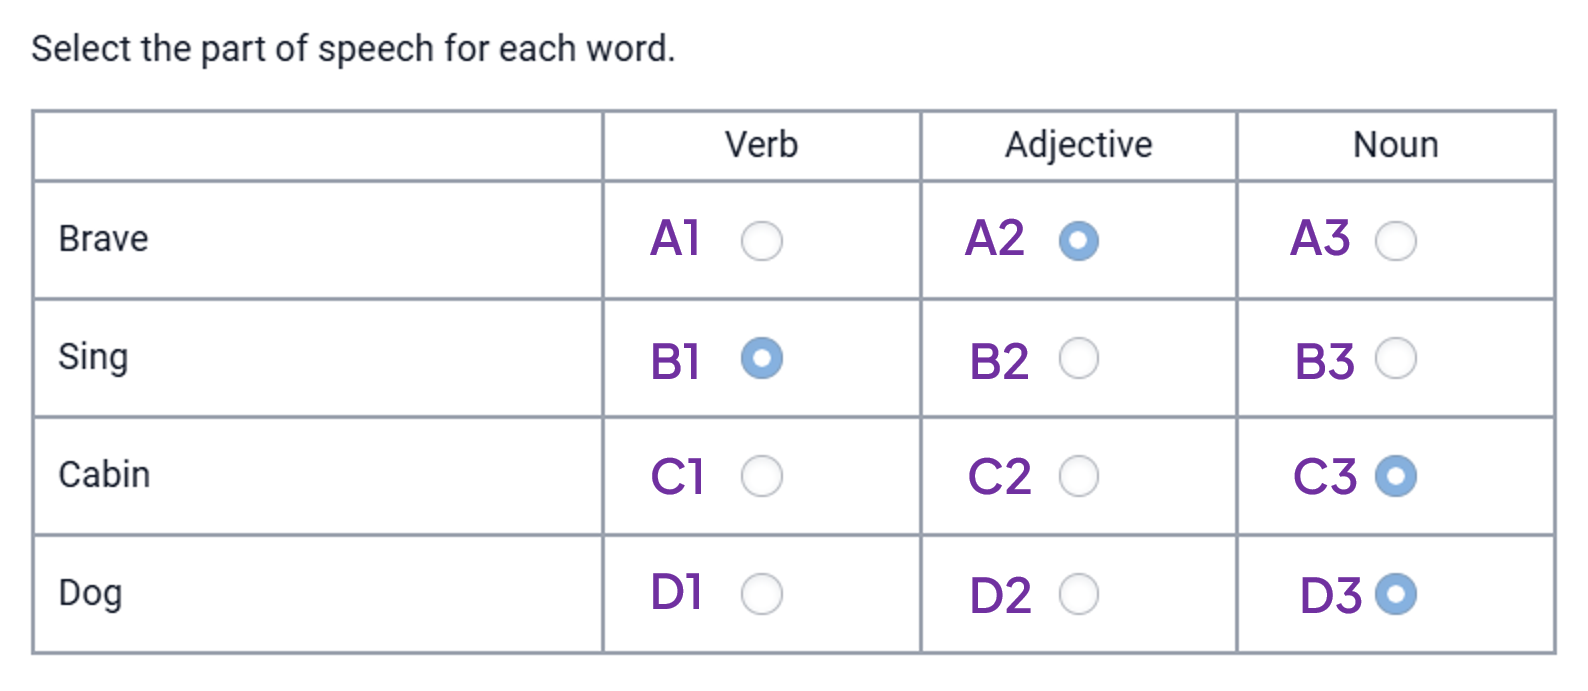
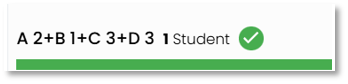
The correct answer is displayed using the plus symbol to represent ‘and’.
Classic User Interface:
Updated User Interface:
Gap Match Items
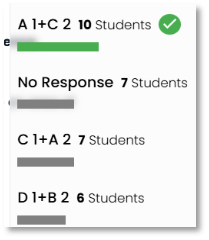
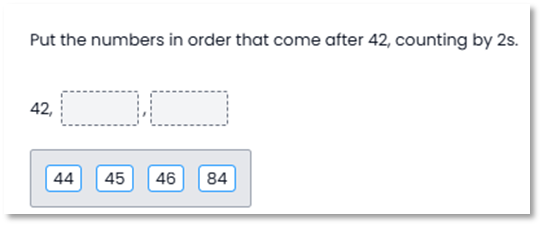
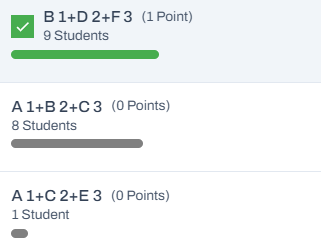
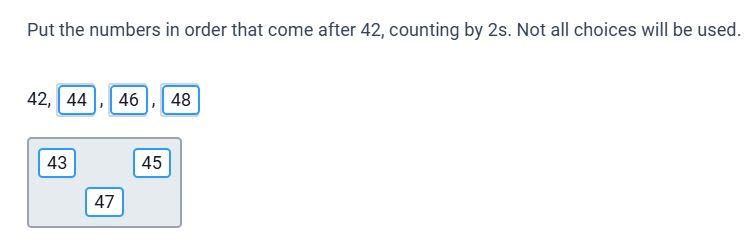
In this sample gap match item, numbers represent gaps in the order in which they appear, and letters represent placement order in the group of choices to add to the gaps.
Classic User Interface:
Updated User Interface:
Tiny Link: https://support.assessment.pearson.com/x/SwANCg
