See also: Performance Dashboard and Reports, Performance Report Summary Tab, Item Analysis, Standards Performance
To view the Performance Report by individual student, use the Student Performance report. In this report you can compare test windows, trait performance and score distribution. This report is only available at the school level.
- Go to Reporting > Performance.
- Select a test administration row to open its Performance Report.
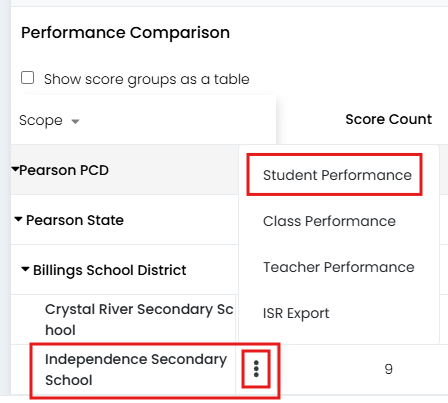
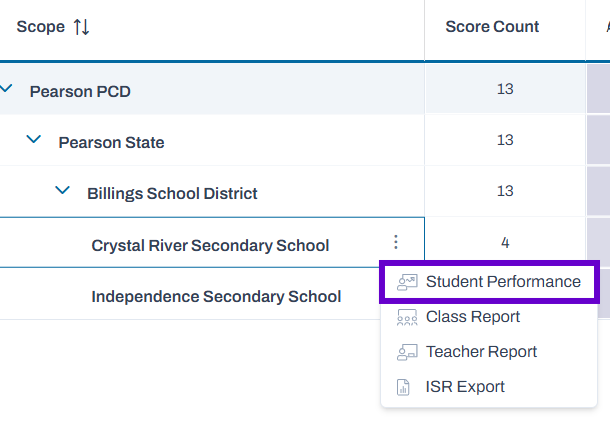
- For a school with results, use the Actions menu to select Student Performance.
Classic User Interface:
Updated User Interface:
Depending on the report setup, the Student Performance Report may have an Item Analysis and Standard Performance tab in addition to the Performance Summary. In the Student Performance report student-by-student view you have many of the same options as when viewing by school or class. A few additional features include the student level roster traits and rubric performance, described below.
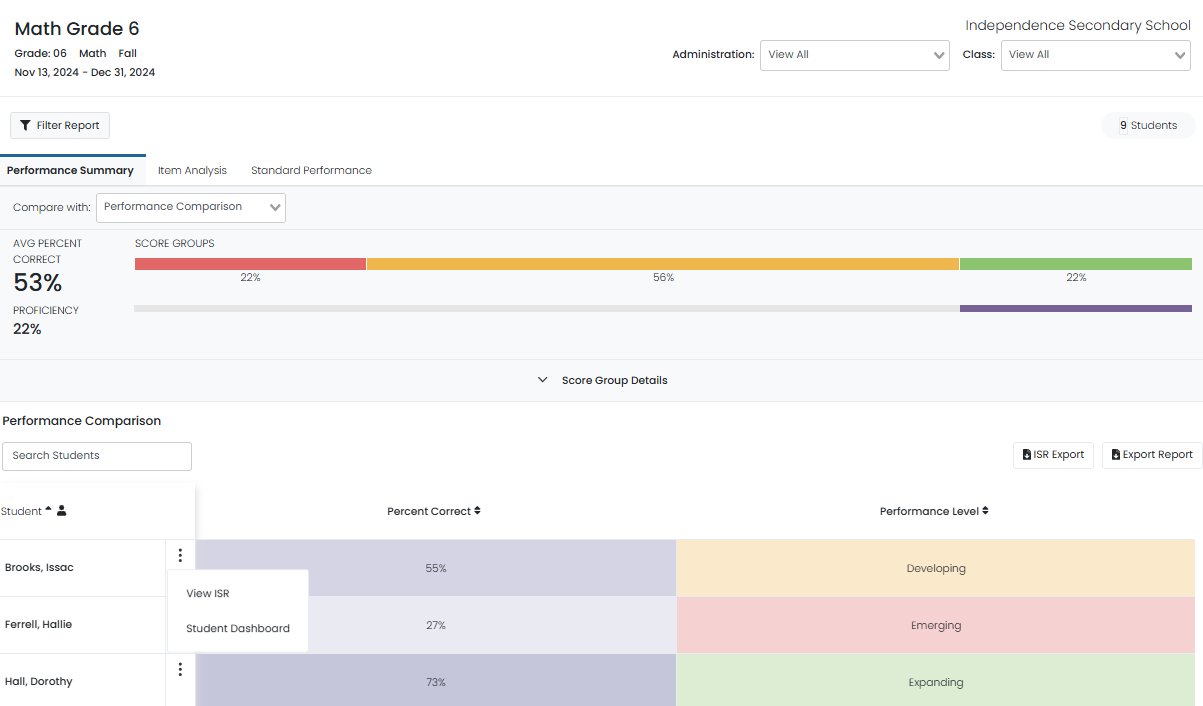
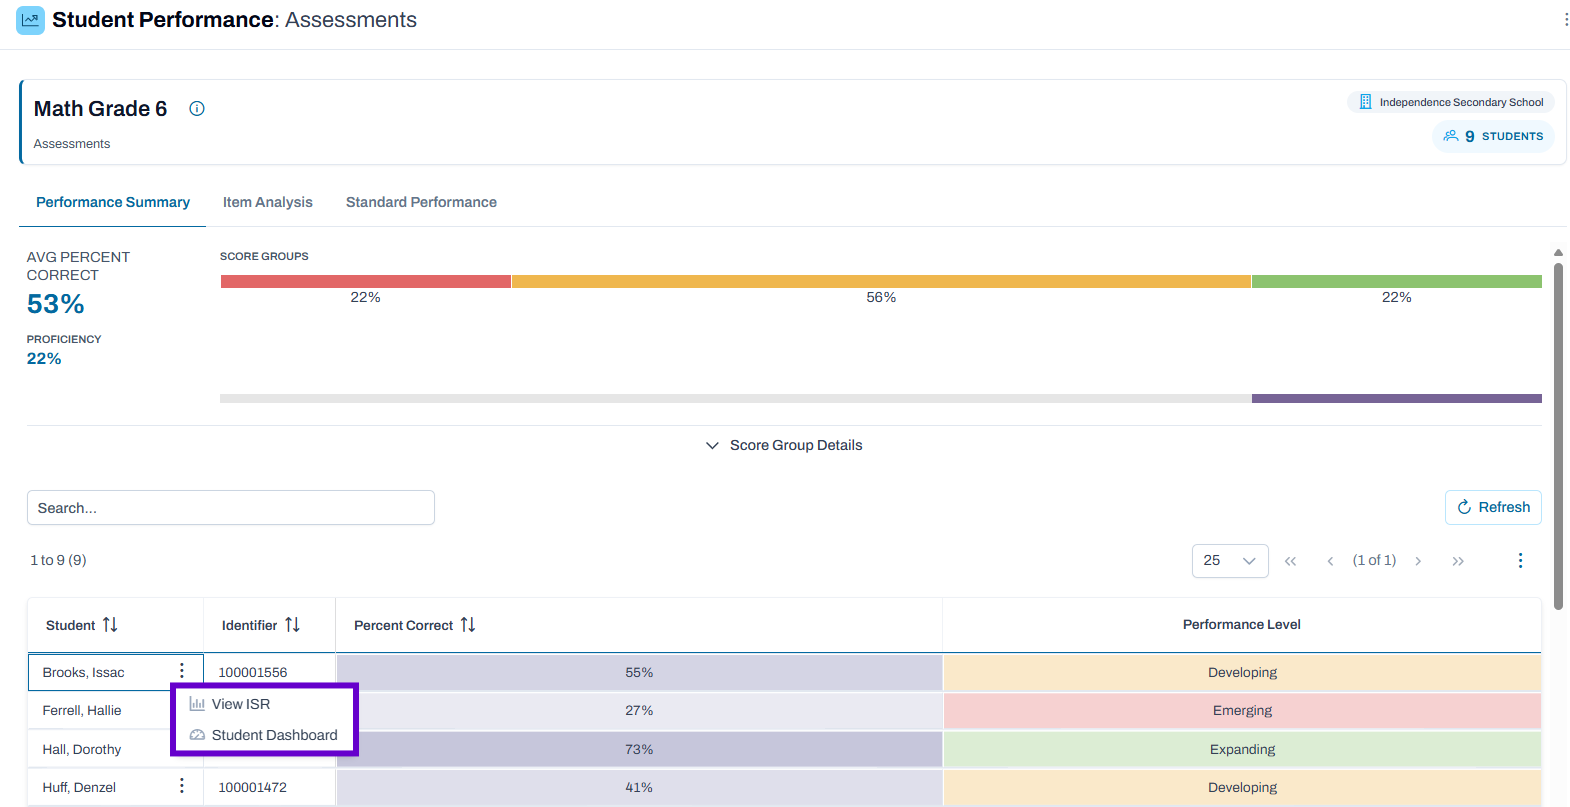
In addition, clicking the three dots next to each student's name will allow you to navigate to either the ISR or Student Dashboard for that student.
Classic User Interface:
Updated User Interface:
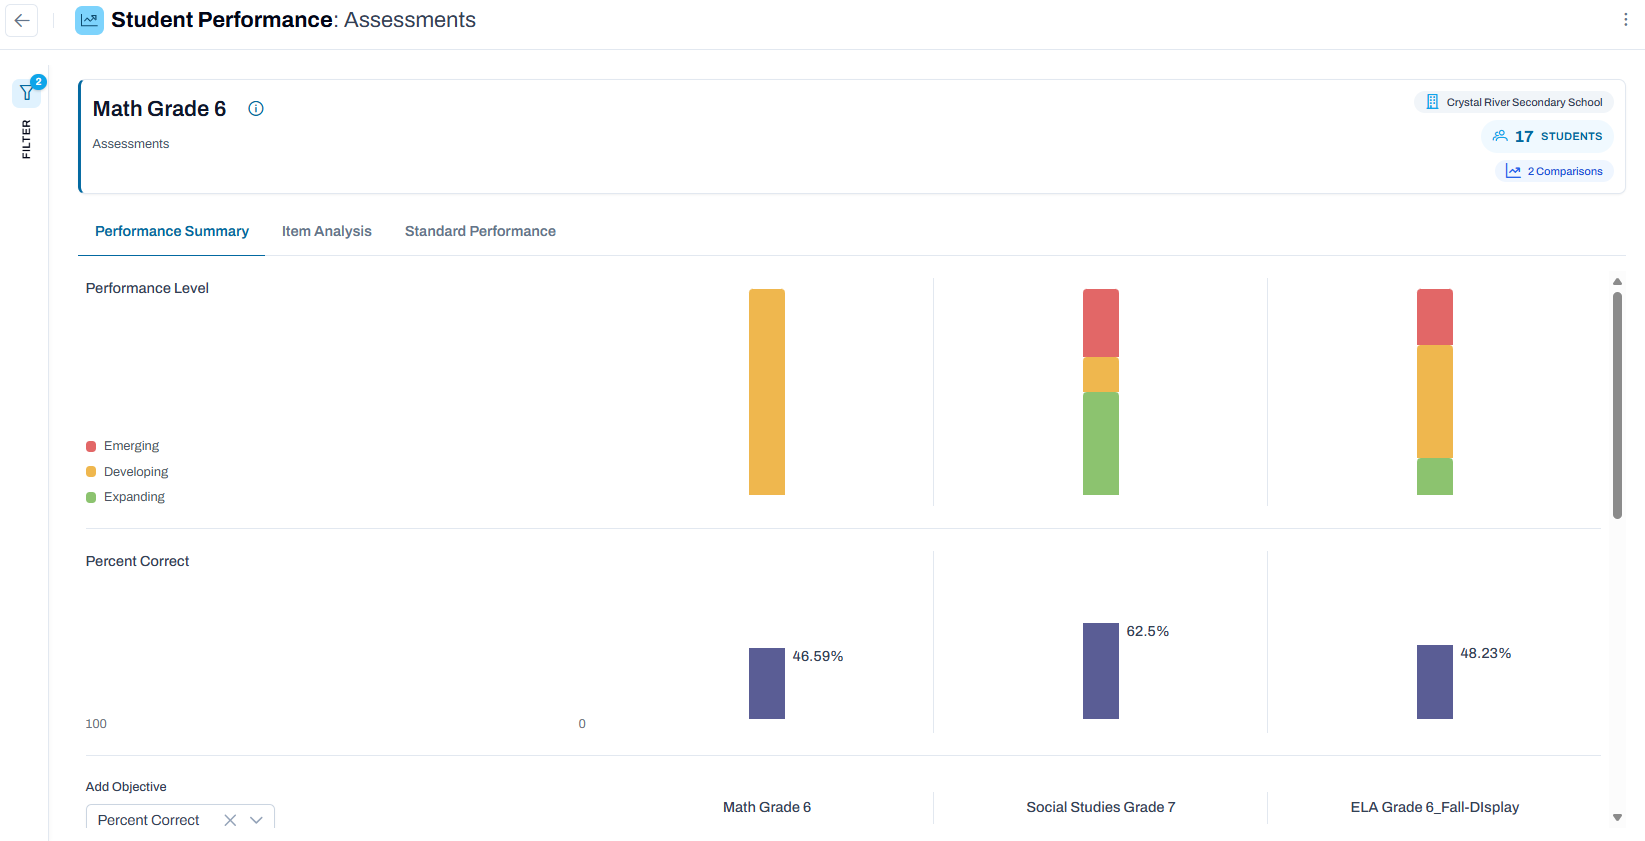
If two or more test windows in a program have results, select up to three windows in the "Compare with" option in the filter menu. An option to add additional available objectives is also available (e.g., percent correct in addition to performance level).
Classic User Interface:

Updated User Interface:
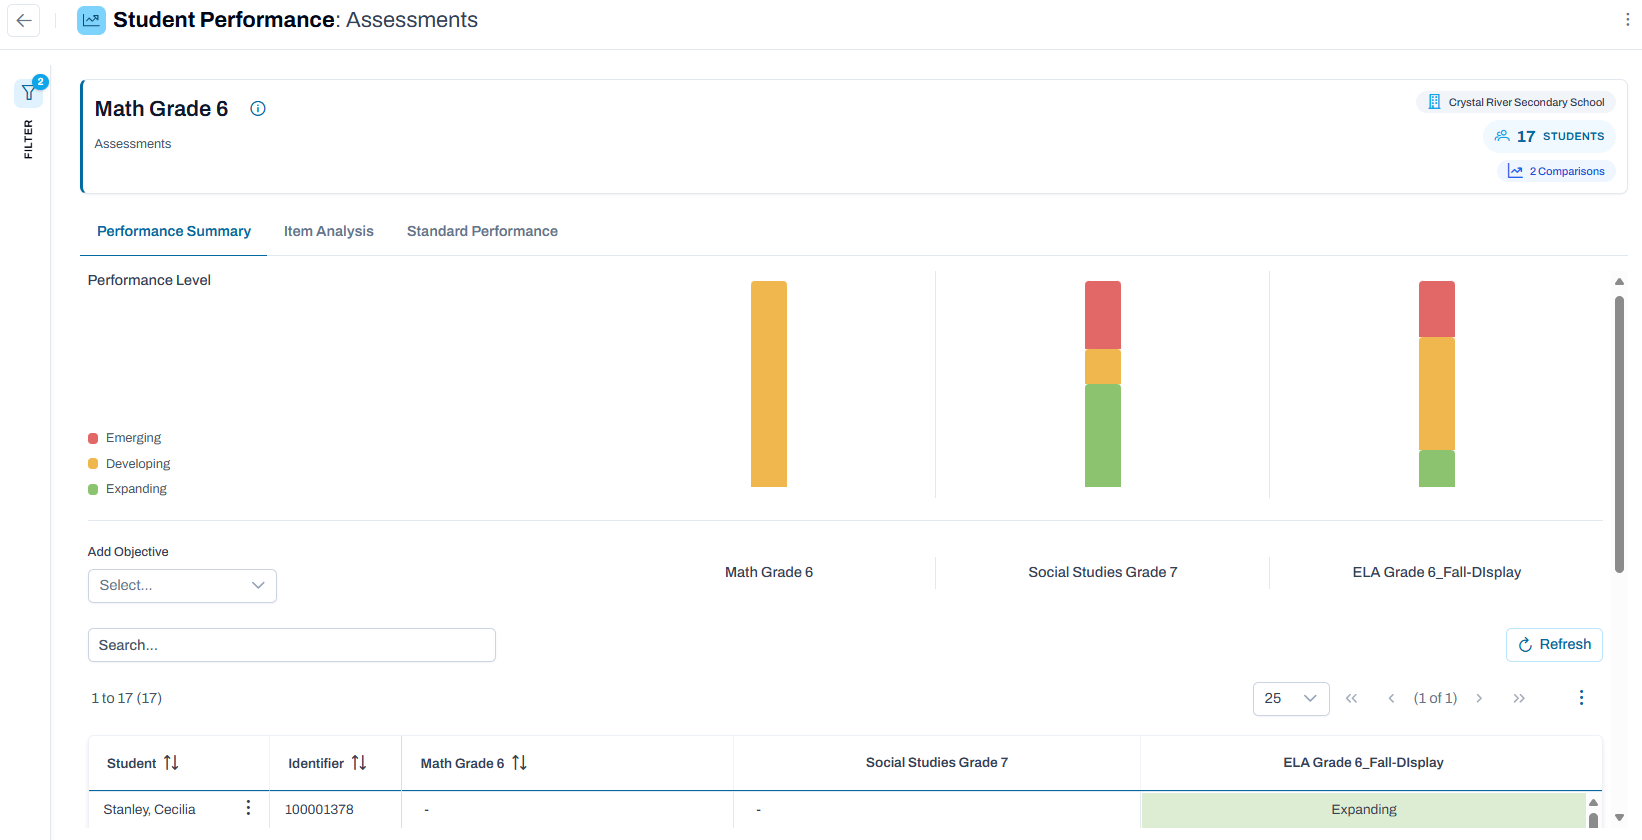
Classic User Interface:

Updated User Interface:
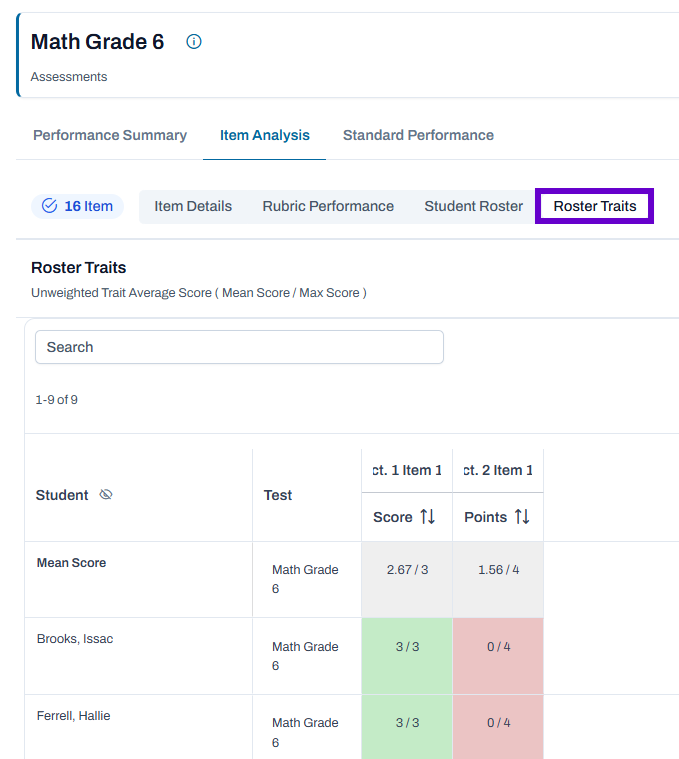
For assessments reporting at the trait level, a view provides a detailed report showing each student's performance on individual traits at the item level.
Classic User Interface:

Updated User Interface:
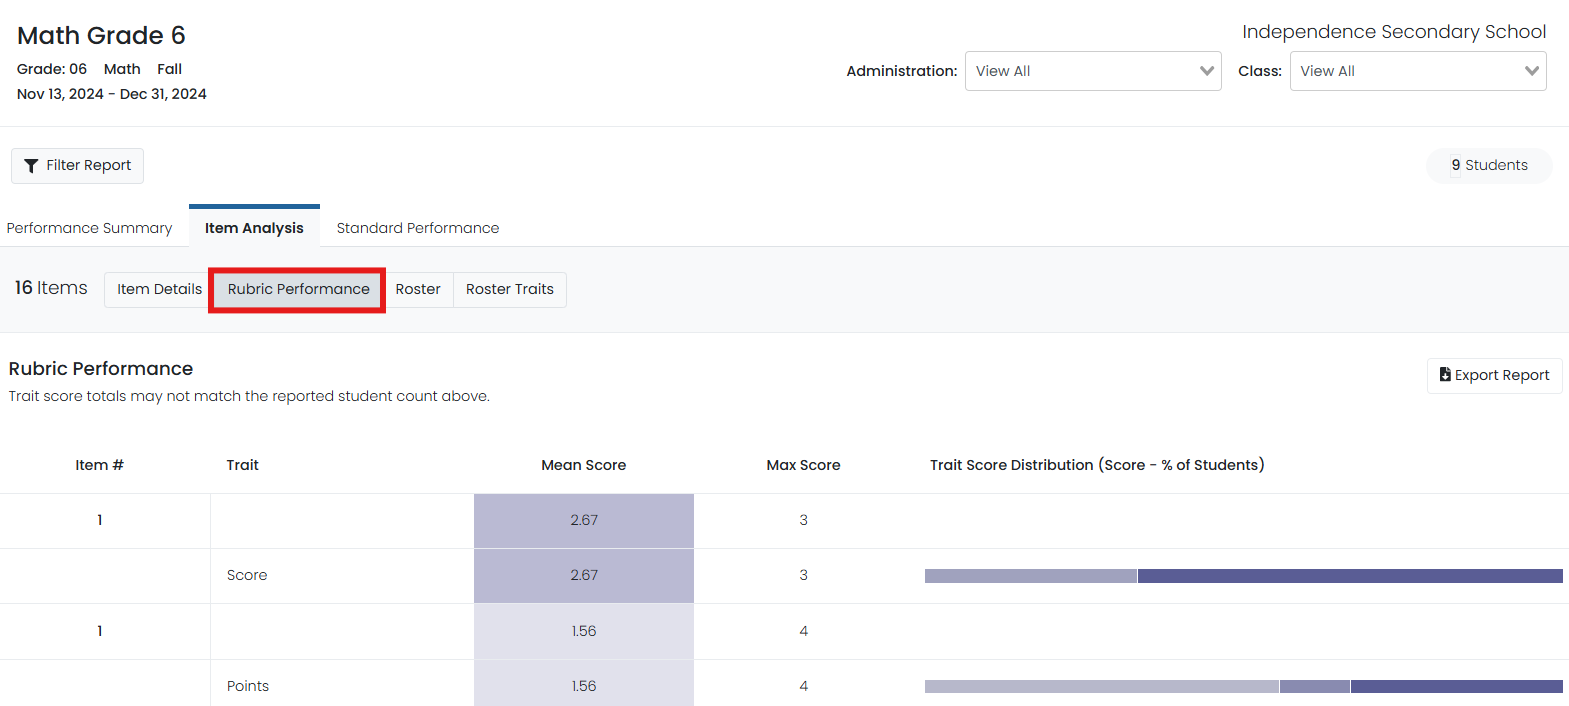
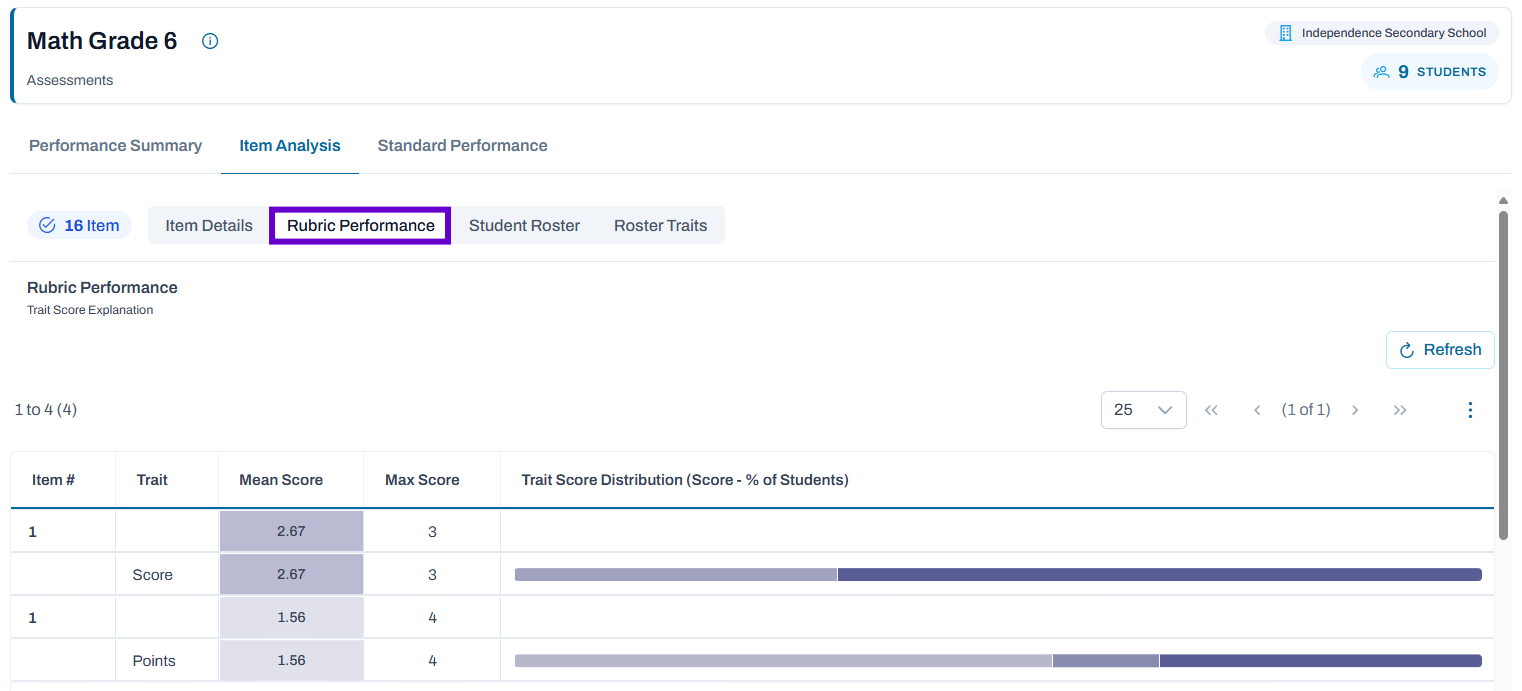
The Rubric Performance report, found in the Item Analysis tab, aggregates student scores to display the overall score for an item and allow you to compare trait performance and score distribution.
If a score is weighted, a small badge appears next to the trait's max score with a number to indicate the factor by which it is multiplied to determine the item score.
Classic User Interface:
Updated User Interface:
Tiny Link: https://support.assessment.pearson.com/x/iwBeCg